There’s a Japanese phrase, hara hachi bu. It means stopping before you’re full—putting your chopsticks down while there’s still a little room.
Kids learn about food at school, too.
It’s not about having exceptional willpower. It’s about paying attention to what you eat and how much, day to day. That’s all.
Yummeee brings that habit into your everyday life. Just take a photo. Every number comes with a source.
How it works, all on one screen.
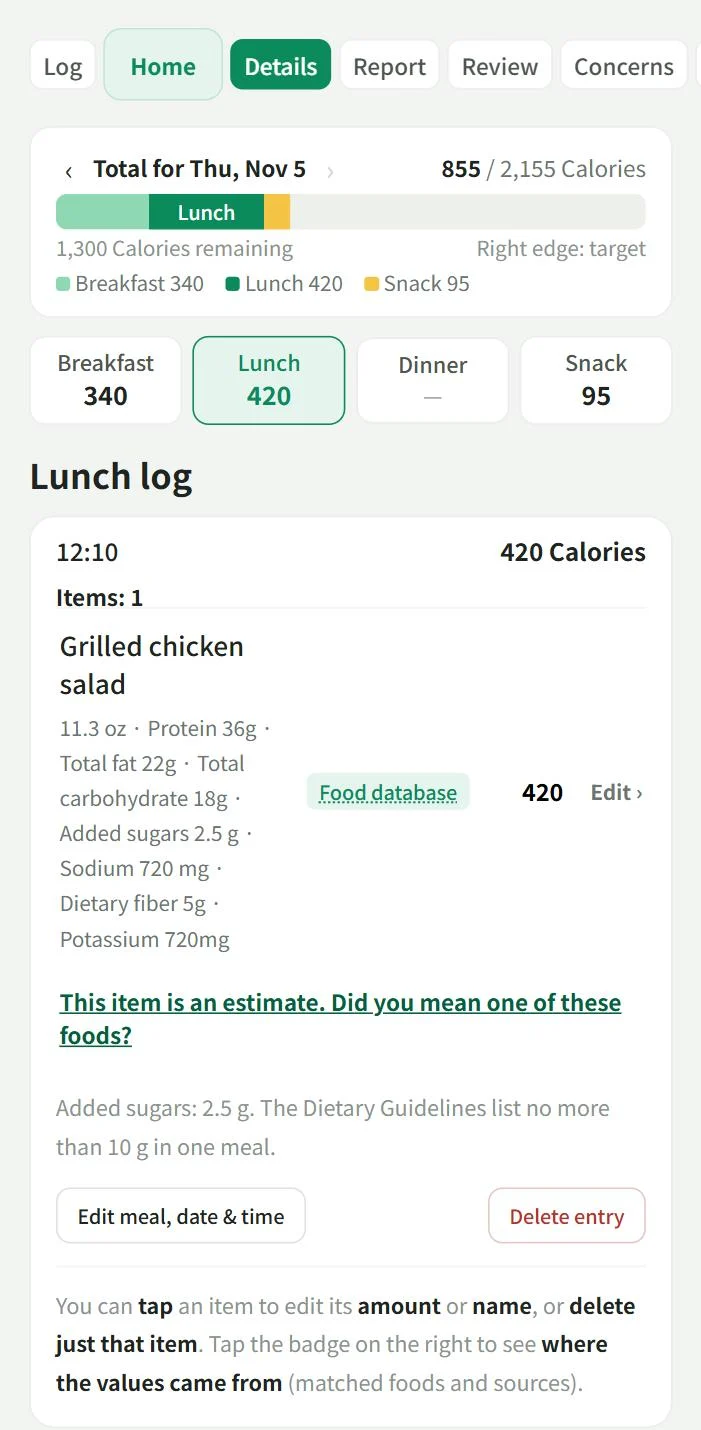
A food log screen with sample data. The notes below explain each part.
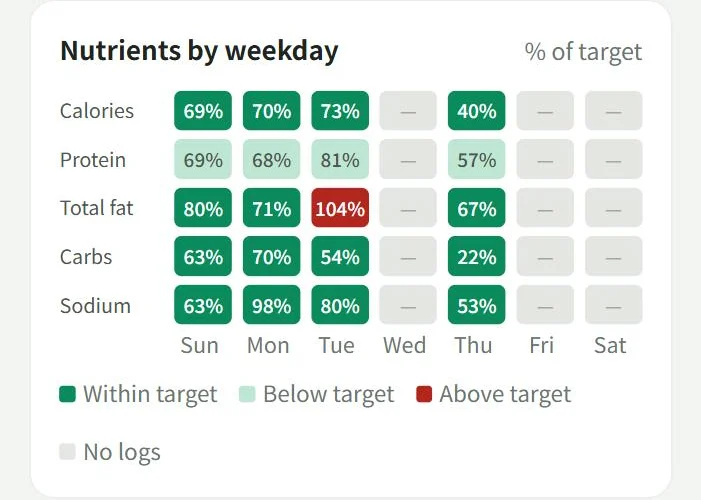
Last 7 days · Nutrients by day
On the Home screen, green means within target, light green means below target, and red means above target.
Your photos become your food log
Time, meal, and takeout tags are added automatically. Thumbnails of your photos appear in the log.
Packaged food values come from the label
“Per 100 g, scaled to the 128 g package.” The calculation appears next to the food name.
AI estimates are labeled
When total sugars aren’t listed on the label, the value is estimated by AI and marked “Total sugars estimated by AI.” Estimates are clearly distinguished from measured values.
One photo, individual food entries
“Packaged chicken salad and 4 other items”—a photo of your meal is split into individual food entries.
AI doesn’t always get it right.
We use values from official databases. Each food entry shows which database its numbers came from.
1
USDA FoodData CentralUSDA
Food data for home-cooked meals, including fatty acids, iron, calcium, and vitamins.
2
Dietary Guidelines for Americans 2025–2030, DRIs, and Daily ValuesNational Academies · FDA
Your targets are based on these U.S. references and your sex, age, and goals.
3
Nutrition label data shared by users (product database)Growing database
Barcode scans and label photos provide values for packaged foods. The database grows as more people use it.
4
Sources for guidanceThe Dietary Guidelines · DRIs · Peer-reviewed research
Open the source links right from the screen.
The database will continue to grow and improve.
Food logs created from photos look like this.
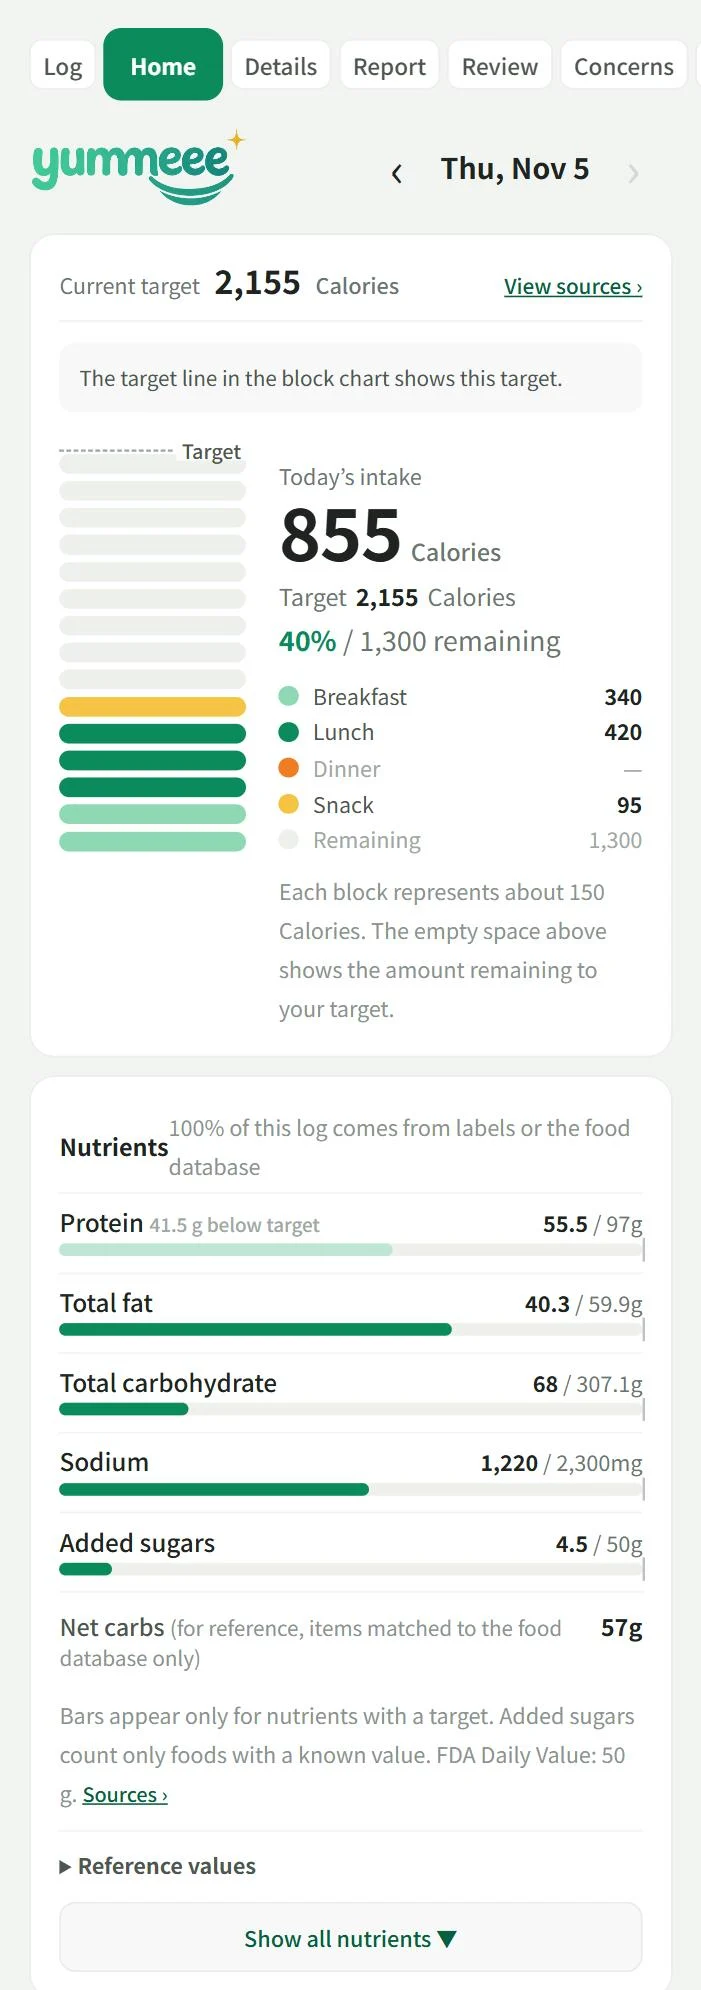
Calories by meal, with a target line
Breakfast, lunch, dinner, and snacks stack from bottom to top. Red above the line shows the amount over your target. Each block is about 150 Calories.
“View sources”
See how the day’s target was calculated, right from the screen.
Red marks amounts above the target
Sodium above the 2,300 mg limit shows in red, so you can see how the day compares.
“35% measured · minimum” / “100% of this log comes from labels or the food database”
Only measured amounts are added up, and the total is labeled as a minimum. Each log shows how much of it is measured.
“Total sugars” and “Added sugars”
Each label explains what the value includes. Reference values are labeled as such.
Your week at a glance.
Heatmap of nutrients by day
Green means within target; red means above target. See how nutrients compare with targets across the week.
Cooking at home, ordering takeout, and dining out
The guidance takes into account weeks with more restaurant meals.
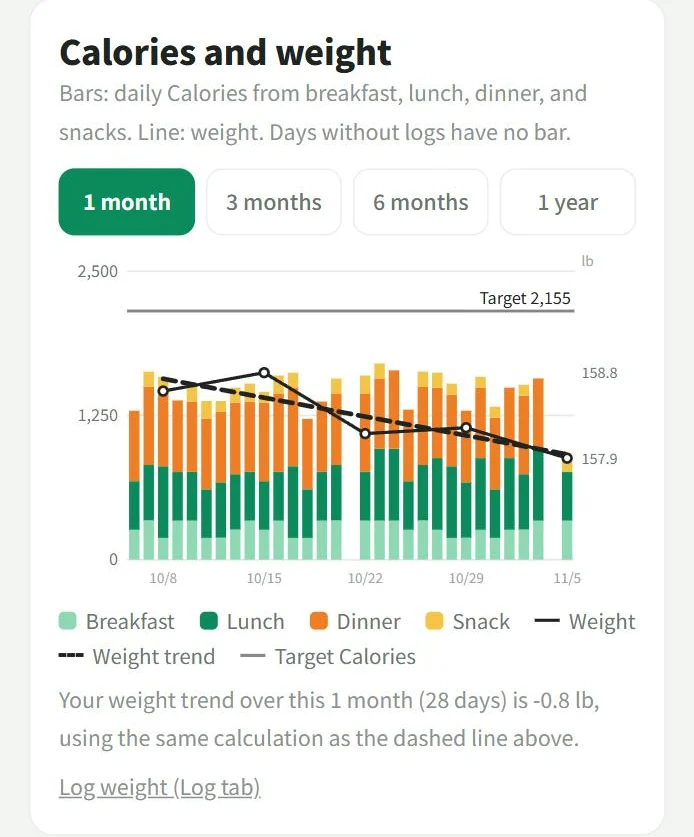
Weight progress, with the numbers behind it.
Energy expenditure also varies, so we don’t promise a specific weight change. Instead, we convert the difference between your logged intake and estimated energy expenditure into an estimated body fat equivalent and show the formula.
Food intake and weight on one chart
Bars show daily Calories from breakfast, lunch, dinner, and snacks. The line shows weight. View 1, 3, or 6 months, or 1 year.
A formula-based estimate gives way to your logged data
As you log more, your estimated maintenance Calories rely more on your own data (for example, 2,545 → 1,873 Calories/day ± 314). The range of uncertainty is shown too.
Our 5 commitments
1All you do is upload a photo.
2AI photo analysis plus features unique to Yummeee.
3A source for every number and every piece of guidance.
4Estimates become more personalized as you use the app.